- Precision in Electrochemistry
- English
Potentiostats
Modular Potentiostats:


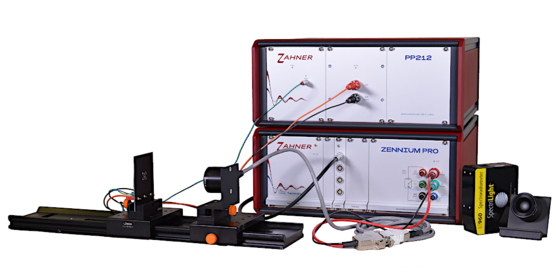
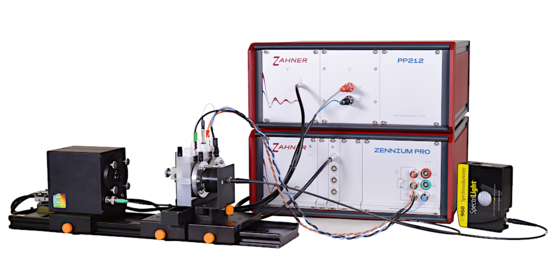
Photoelectrochemistry & Photovoltaic
CIMPS system with extensions and accessories


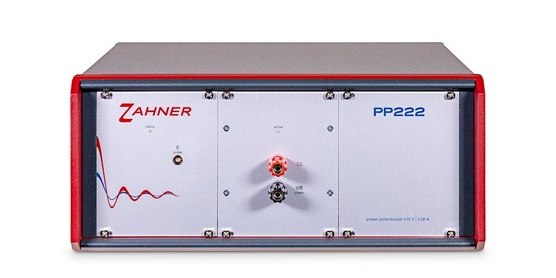
External Potentiostats
Four quadrant external potentiostats


Electronic Loads
Single quadrant electronic loads

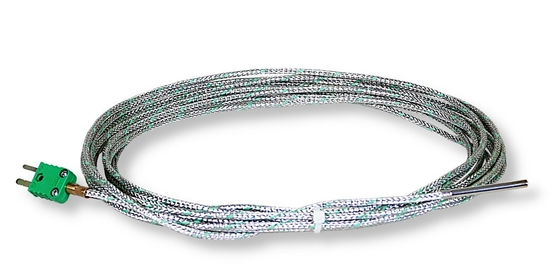
Probes
Zahner's probes for special applications


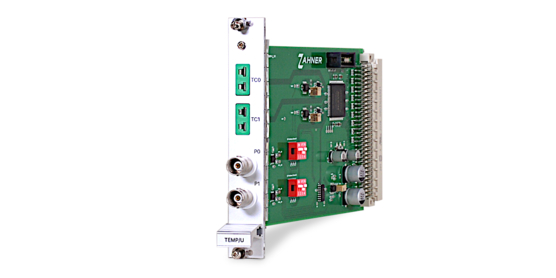
Addon Cards
Addon cards for extended capabilities


Multiplexer
Multiplexer to simultaneously connect multiple cells


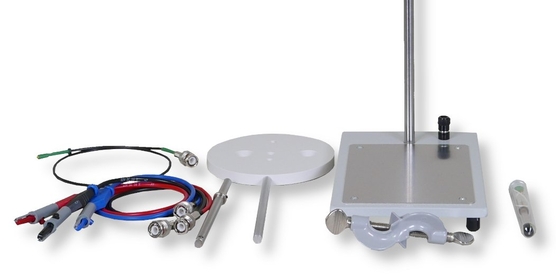
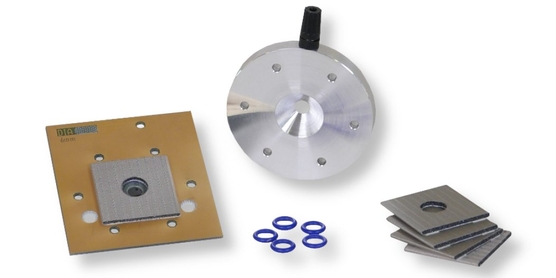
Extension Kits
We offer dedicated extension kits as measurement tools developed by Zahner. The coating and laminate tester (COLT) extension kit is used in investigating the corrosion behavior of coatings and laminates.
Extensions Kits for special experiments
Cell Kits
Besides the following cells, we offer a broad range of electrochemical cell kits for application in electrochemistry and photoelectrochemistry. Please contact our sales team to find out if we can offer you a cell suitable to your needs.
Cells for electrochemical & photoelectrochemical applications


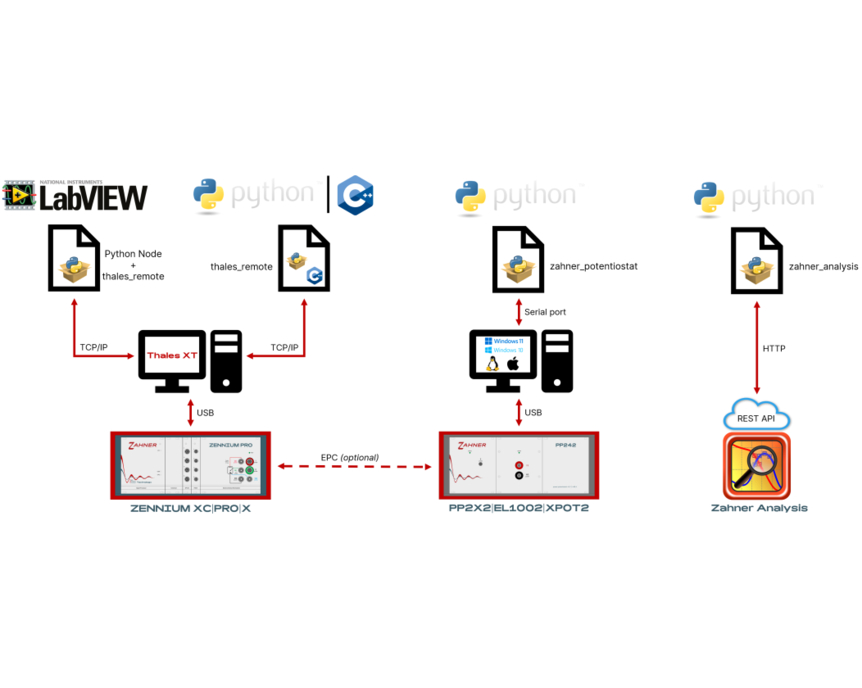
Software
Zahner's software for measurements and analysis

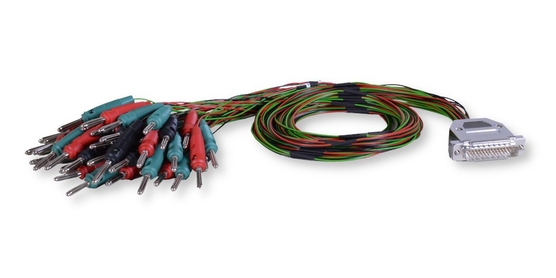
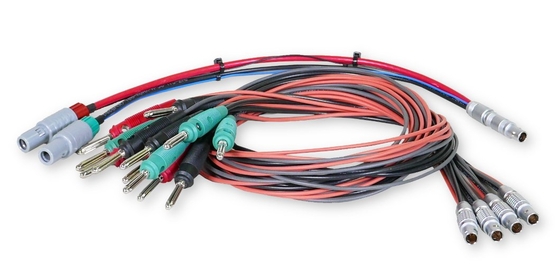
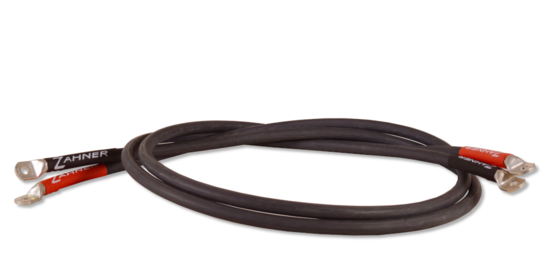
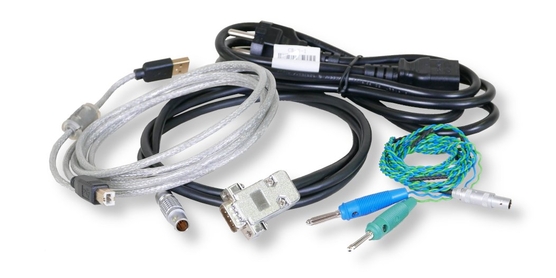
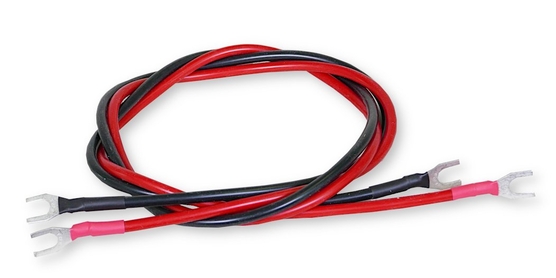
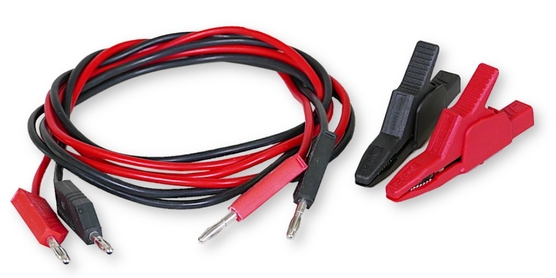
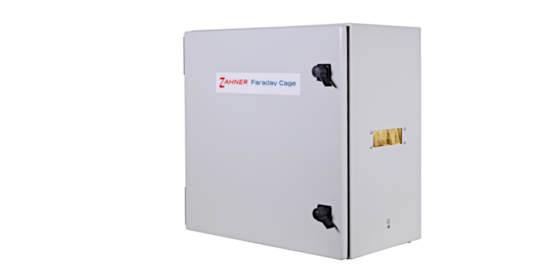
Accessories
Zahner offers different kinds of accessories (cables, Faraday cage & Light exclusion box etc) for use with our potentiostats.
Accessories for electrochemical and photoelectrochemical applications
Entry level potentiostat
Compact single and multichannels entry level potentiostats from the American company "Admiral Instruments".
Compact single or multichannel potentiostats


Request a quote
Is this the right product for you? Contact our sales team to get further information about our products and their suitability to your individual applications.
Contact Sales