
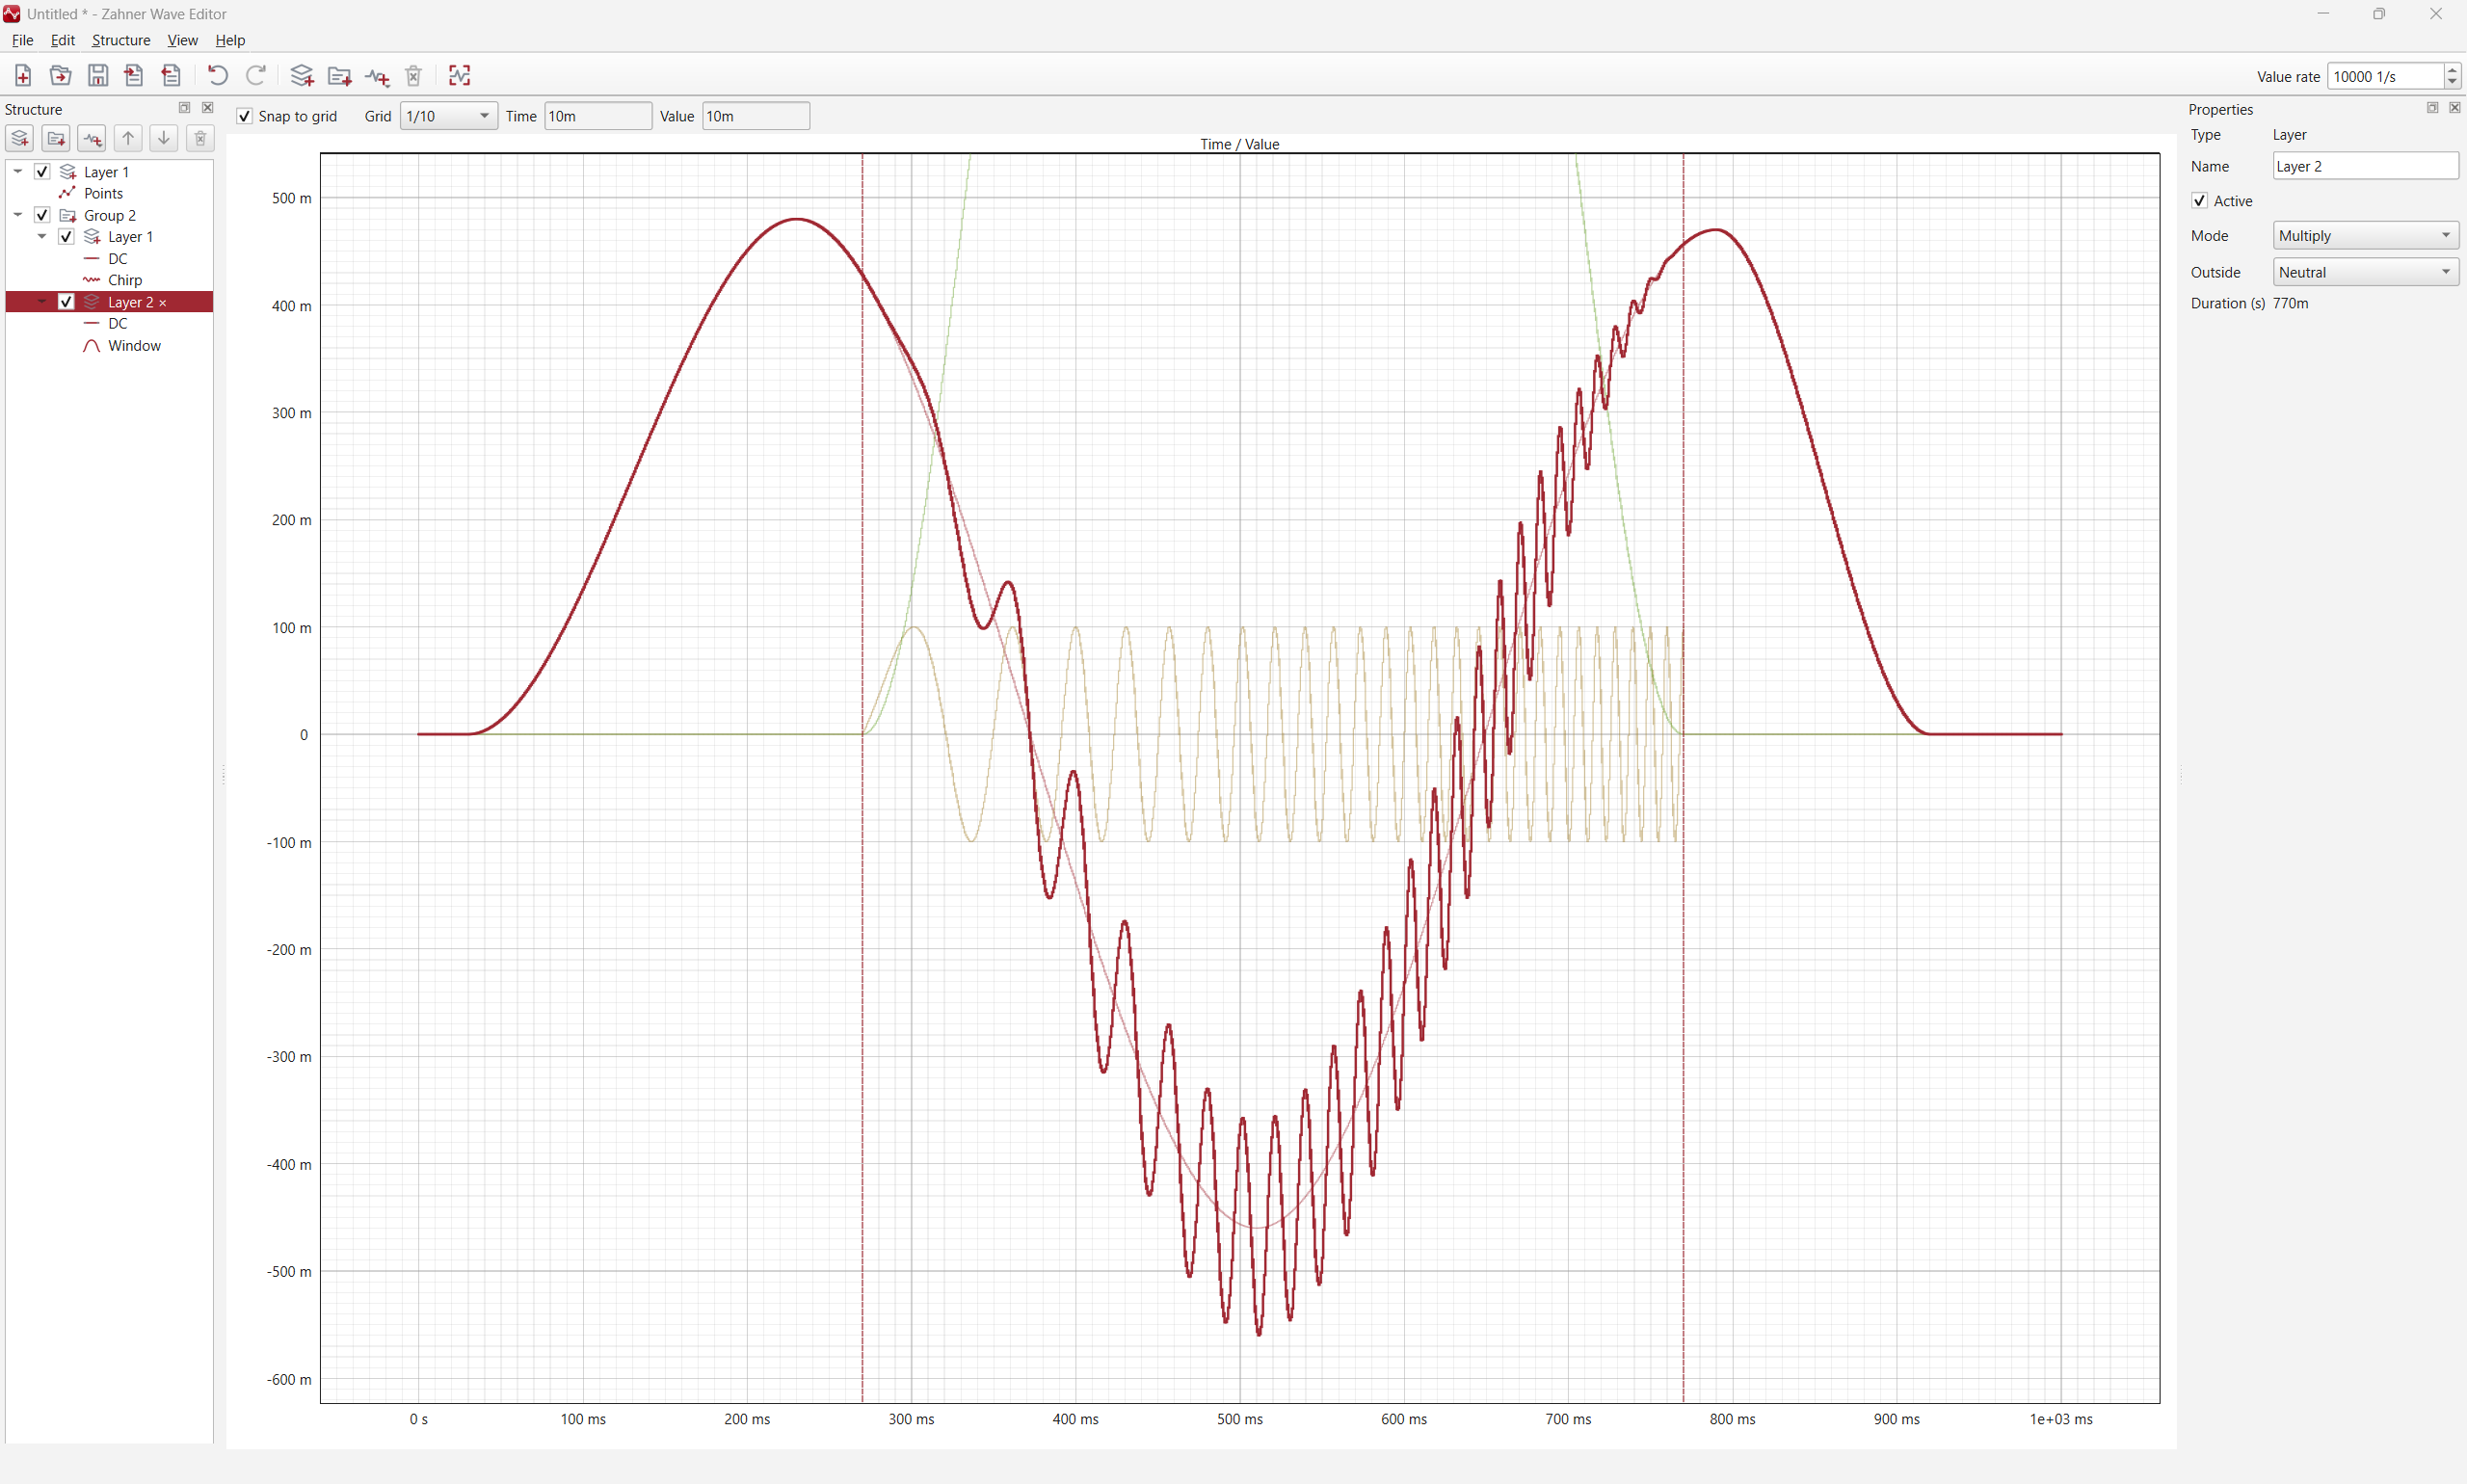
The Zahner Wave Editor is a graphical editor for arbitrary waveforms. A signal is built from layers and time-ordered segments, such as sine, chirp, pulse, ramp, Ricker wavelet, a freely typed formula or hand-drawn points, and the combined curve is shown in a live plot. The result is exported as sampled values: as CSV for the Custom Waveform block of Zahner Lab, as binary values for the zahner_link library, or for any function generator, simulation or test bench that reads a sampled curve.
Custom Excitation Signals for the IM7
The editor was developed to create custom excitation signals for the IM7, IM7c and IM7x electrochemical workstations, which play back an arbitrary curve potentiostatically or galvanostatically, one value per tick. The editor samples the waveform at a constant value rate; with the same rate passed to the measurement, the curve is played back exactly as designed.
- Without programming: in Zahner Lab, the Custom Waveform block of the Custom Experiment Builder reads the CSV export directly. The Wave Editor is also an optional component of the Zahner Lab installer.
- From Python: the binary export is exactly the byte stream that the zahner_link library uploads as a waveform resource for a WaveFileJob, with no conversion step of your own. The ArbitrarySignal notebook is a complete, runnable example.
Layers, Segments and Generators
Every layer is a sequence of segments and is added to or multiplied with the layers above it; layer groups combine their own layers first, so a structure such as A + (B × envelope) is built directly. Twelve segment generators are available, from DC, ramp, sine, square and chirp to Ricker wavelets, formulas, point lists and window functions such as Hann, Blackman or Kaiser. For electrochemistry, normal pulse, differential pulse and square wave voltammetry come as complete waveforms, with the same parameters as the corresponding IM7 jobs. Points and segment boundaries are dragged directly in the plot, and a repeating segment lets one sine stand for 10,000 periods.
Spectrum and Statistics
A second plot shows the amplitude spectrum (FFT) of the whole waveform, with a selectable sample rate, window and logarithmic axes. Next to it, the editor lists DC, RMS, peak, crest factor, slew rate, fundamental and THD, and it warns when the sample rate is too low for the signal. Both follow every edit.
Open Formats and Free Software
Waveforms are saved as human-readable JSON (.zwj). The CSV export holds one value per line, the binary export raw little-endian double values without a header, so NumPy, MATLAB or a SCPI upload read them as they are; curves from other tools come back in through the CSV import.
The Zahner Wave Editor is free software under the GNU General Public License, version 3. It runs on Windows, Linux and macOS, in English or German, without an account, cloud or telemetry. The source code, the release notes and the issue tracker are on GitHub; the installers of the current release are listed under Downloads below.
The key features at a glance: